
Imagine you order a pizza. You can see the cook stretch the dough. You see the sauce go on. You see it slide into the oven. You know where your pizza is. You know what is happening next. That is the basic idea behind visual lead time. It makes waiting easier to understand. It turns a hidden process into a visible one.
TLDR: Visual lead time shows how long work takes by making each step easy to see. It helps teams spot delays, queues, and waste fast. In lean manufacturing, it supports better flow, faster decisions, and happier customers. Think of it as a progress map for work.
What Does Visual Lead Time Mean?
Visual lead time refers to the way a company shows the time it takes for work to move from start to finish. It is not only the time itself. It is also how that time is made visible.
In manufacturing, lead time is the total time between a request and delivery. For example, it may start when a customer places an order. It may end when the finished product ships.
Visual lead time adds a simple twist. It uses charts, boards, signals, colors, cards, labels, screens, or floor markings to show where the work is and how long it has been there.
So instead of asking, “Where is that order?” everyone can just look. The answer is right there.
Why “Visual” Matters
Work can hide. It hides in email. It hides in piles of parts. It hides in machines waiting for setup. It hides in someone’s “I’ll do it later” folder.
When work hides, problems hide too.
Visual systems bring those problems into the light. They show what is moving. They show what is stuck. They show what is late. They make the process honest.
This is important because people are very good at reading visual clues. A red tag says, “Help!” A full column on a board says, “Too much work!” A product sitting in the same place for three days says, “Something is wrong here!”
It is like putting traffic lights inside your factory. Green means flow. Yellow means caution. Red means stop and fix it.
A Simple Definition
Here is a clean definition:
Visual lead time is the visible tracking of how long a task, order, or product takes to move through a process, from request to completion.
It answers simple questions:
- When did this work start?
- Where is it now?
- How long has it been waiting?
- What step comes next?
- Is it on time or late?
That is it. No magic wand. No giant spreadsheet dragon. Just clear information that people can see and use.
Visual Lead Time vs. Regular Lead Time
Regular lead time is a number. For example, “This product takes 12 days to deliver.”
Visual lead time shows the story behind that number.
Maybe only 2 of those 12 days are actual production. The other 10 days may be waiting. Waiting for materials. Waiting for inspection. Waiting for a machine. Waiting for approval. Waiting for Bob, who is somehow always at lunch.
Visual lead time helps you see the waiting time. And in lean manufacturing, waiting is a big type of waste.
Common Examples of Visual Lead Time
Let’s look at some easy examples.
1. Kanban Boards
A Kanban board shows work in columns. These may include:
- To Do
- In Progress
- Inspection
- Done
Each job is shown as a card. As the job moves, the card moves. If a card stays in one column too long, the team sees it right away.
This is visual lead time in action. The board shows movement and delay.
2. Color-Coded Job Tickets
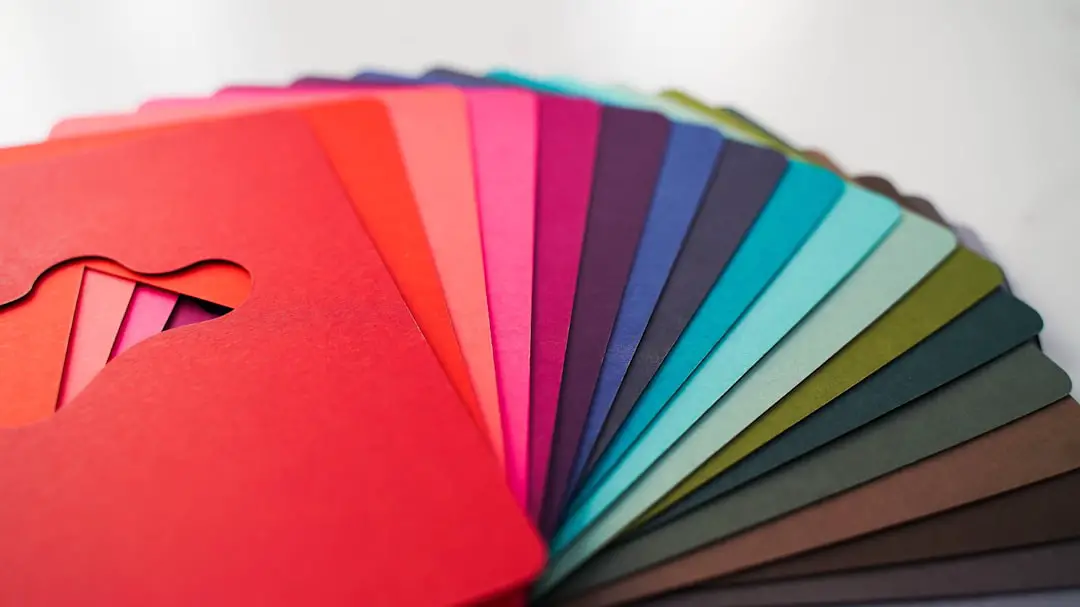
A factory may use colored tickets to show urgency. For example:
- Green: On schedule
- Yellow: Needs attention soon
- Red: Late or blocked
This makes priorities clear. Nobody needs to read a 14-page report. Red gets attention. Simple.
3. Time Stamps on Work Orders
Each order may show the date and time it entered a step. If a part entered welding on Monday and it is still there on Thursday, the team can see the delay.
Time stamps make lead time visible. They also make excuses less comfortable. Sorry, Thursday.
4. Floor Markings and Zones
Factories often use marked areas on the floor. One area may be for incoming parts. Another may be for inspection. Another may be for finished goods.
If the inspection zone is overflowing, the team can see the bottleneck. The floor is telling a story.
5. Digital Dashboards
Some teams use screens to show live status. A dashboard may display average lead time, delayed orders, current queue size, and output for the day.
This is useful when teams are spread out. It also helps managers track performance without walking around asking, “Any updates?” every nine minutes.
How Visual Lead Time Works in Lean Manufacturing
Lean manufacturing is about creating value with less waste. It focuses on flow. It asks, “How can we give customers what they need with less delay, less effort, and fewer mistakes?”
Visual lead time supports lean because it makes waste easy to spot.
Lean often talks about different wastes, such as:
- Waiting: Work sits still.
- Overproduction: Too much is made too soon.
- Inventory: Too many parts pile up.
- Motion: People walk too far or search too much.
- Defects: Errors cause rework.
Visual lead time helps reveal these wastes. If work waits, you see it. If inventory piles up, you see it. If defects keep returning to the same station, you see it.
And once you see waste, you can fix it.
Benefits of Visual Lead Time
1. Faster Problem Solving
When delays are visible, teams can act faster. They do not need to dig through systems or hold long meetings. They can look at the board and say, “This job is stuck. Why?”
That question starts improvement.
2. Better Team Communication
Visual lead time gives everyone the same picture. Production, quality, shipping, and management can all see what is happening.
This reduces confusion. It also reduces the classic workplace mystery known as “I thought you had it.”
3. Shorter Lead Times
You cannot reduce what you cannot see. By showing delays, queues, and bottlenecks, teams can remove them.
Less waiting means shorter lead time. Shorter lead time means faster delivery. Faster delivery means customers smile more. Smiling customers are good for business.
4. Less Stress
Hidden work creates stress. People worry about surprises. They chase updates. They guess.
Visible work feels calmer. Everyone knows the status. Everyone knows what needs attention. The process becomes less spooky.
5. Better Accountability
Visual lead time is not about blaming people. It is about improving the process. Still, it does make ownership clear.
If a job is stuck at a step, the team can help. The goal is not “Who messed up?” The goal is “How do we get this moving?”

How to Start Using Visual Lead Time
You do not need a fancy system. Start small. Pick one process. Choose one product line. Or choose one type of customer order.
Then follow these steps:
- Map the process. List each step from order to delivery.
- Measure time. Record when work enters and leaves each step.
- Make it visible. Use a board, tags, colors, or a dashboard.
- Watch for stuck work. Look for queues and delays.
- Improve one thing. Fix the biggest bottleneck first.
Keep it simple. If your visual system needs a 40-minute training course, it may be too complex. The best visual tools are easy to understand at a glance.
A Quick Example
Say a company makes metal brackets. The customer expects delivery in five days. The process has five steps: cutting, bending, welding, painting, and shipping.
The team creates a board with five columns. Each order gets a card. The card shows the start date. Every morning, the team checks the board.
They notice many cards sit in painting for two days. That is the bottleneck. After checking, they learn paint drying racks are always full. So they add better scheduling and free up rack space.
Now orders move faster. Lead time drops from five days to four. Tiny board. Big win.
Final Thoughts
Visual lead time is a simple but powerful idea. It shows how long work takes and where it gets stuck. It turns invisible delays into visible clues.
For lean manufacturers, this is gold. It helps teams reduce waste, improve flow, and deliver faster. It also makes daily work easier to understand.
In short, visual lead time is like giving your process a scoreboard. Everyone can see the game. Everyone can help the team win.