

Data visualization is a widely used but also very effective technique. When we see numbers, we know that we probably, will not remember them if we do not focus. But when we have a pictorial view, we will probably, recall the data. Is it not nicer to see a chart, preferably in color, than a seemingly ordinary pile of numbers? Research shows that a person remembers up to 50% more data if visualization is done.
Graphs facilitate the visualization of data. But in a way that leaves the maximum impression on the audience. You have probably had a chance to see the chart someday. And you even know that in movies we can see made charts on big cartons. Today, due to digitalization, it is easy to create a chart.

You can choose the type, color, size, appearance, etc. In fact, you can customize everything to your needs and desires. The chart can also be created online. Now, we will present you a couple of the best free, but also you have to pay, tools for online charting. However, before we present the tools, it is crucial to know a few things.
First, no one was born a scientist. If you do not know how to make charts or anything about them, online tools will help you master everything painlessly. What all the tools have in common is ease of use. In fact, that is what we are looking for in most cases. Especially if you are a beginner, you will want to learn starting from the simplest explanation. If a tool can handle a large set of data, then we will, of course, rank it among the best tools.
And, last but not least – the price. If you already pay for an online tool, it does not necessarily mean it is better than free. The price does carry with it some responsibility. If you are already buying, look at the features, service, support, capacity, etc. Be clever enough for your money.
Now that we have established all of this – let’s get down to business.
1. wpDataTables
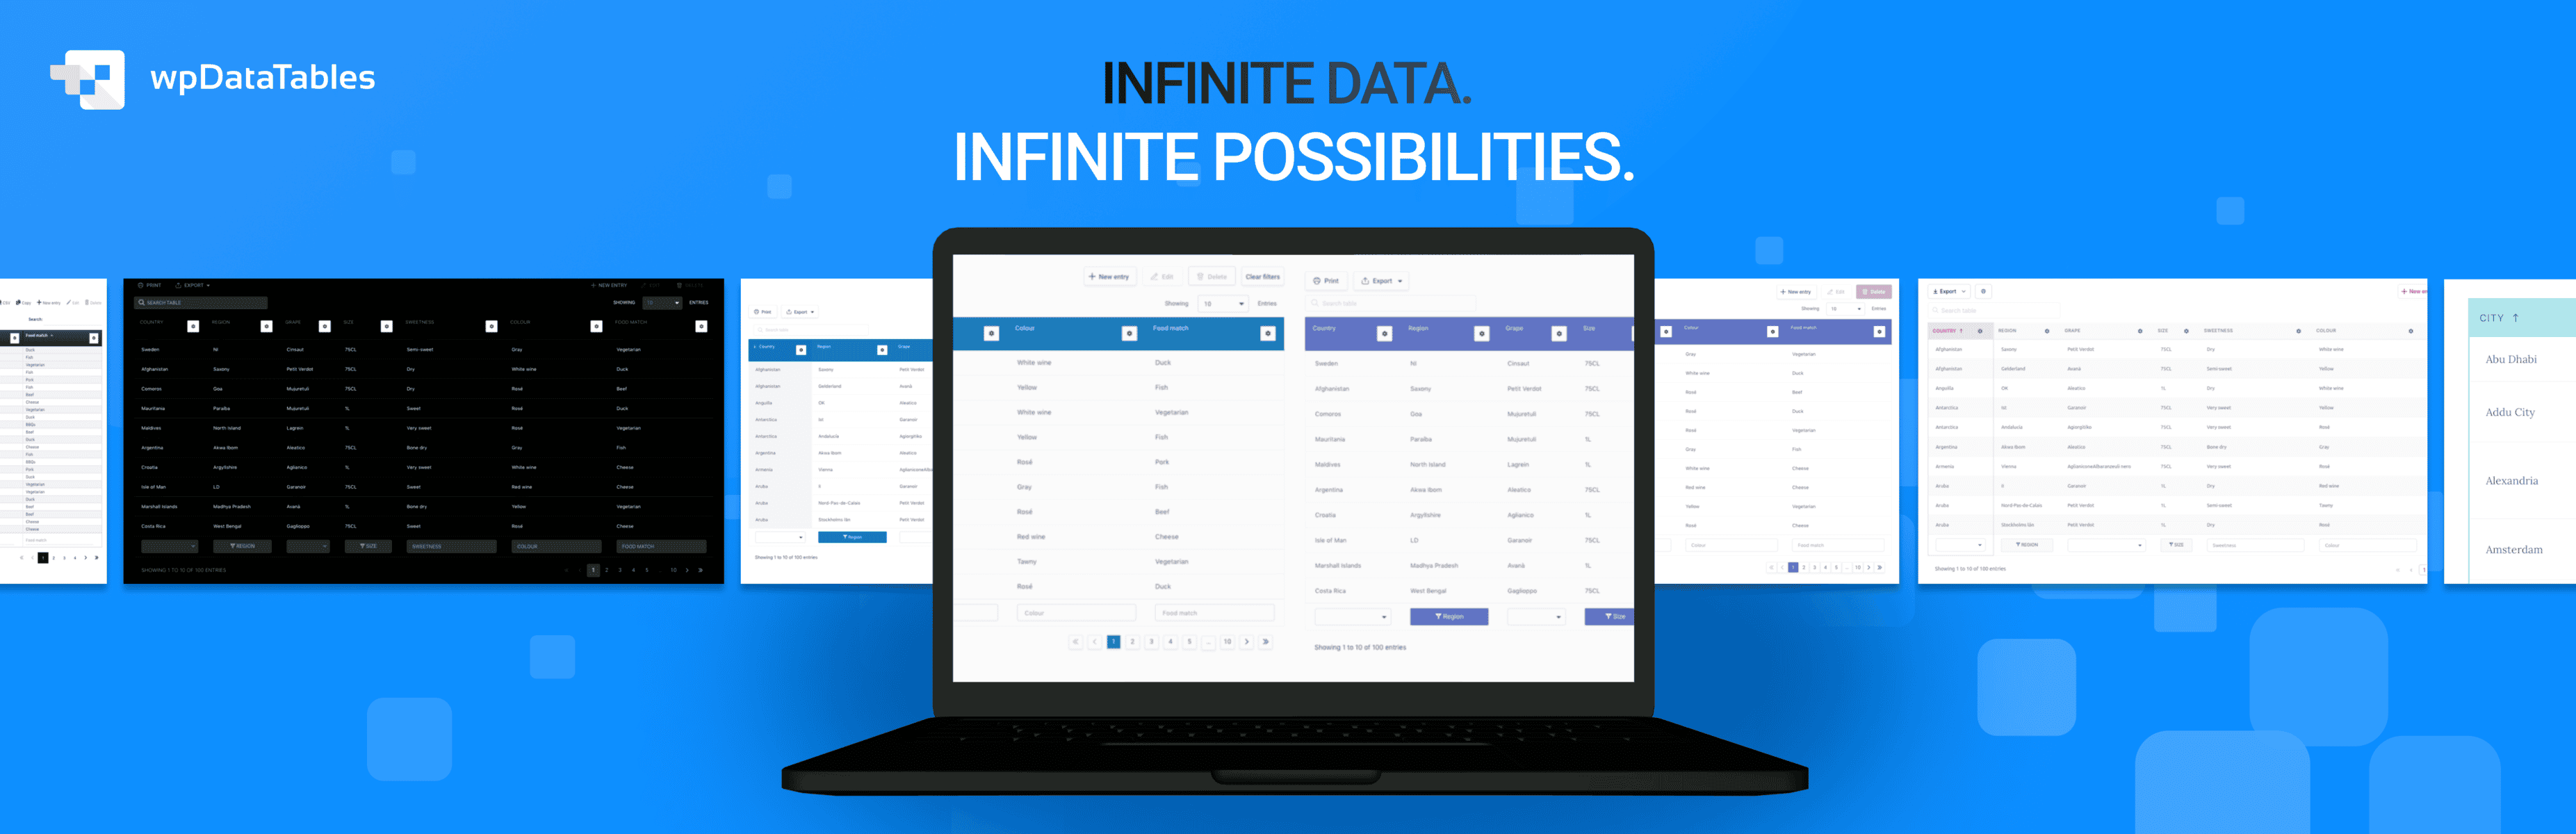
If you have a WordPress website and you’re looking to integrate it with Google Sheets, wpDataTables is your perfect match! This plugin empowers you to effortlessly manage data and create fully customizable tables and charts.
Who says that working with tables has to be boring? Tables, charts, and data management have never been easier than with the wpDataTables plugin and its Google Sheets integration. Setting up integration is a breeze, even for users with limited technical skills. You also get an intuitive setup wizard that guides you through the entire process step by step.
What sets this Google Sheets Integration WordPress plugin apart from the rest is its extensive library of resources aimed to help you manage everything easily.
Once you integrate wpDataTables with Google Sheets, the real-time data synchronization is impressive. Any changes you make in Google Sheets are instantly available on your WordPress website. You also have full control over your data, making sure that only authorized users can see it and make changes. You can even skip certain columns or add new ones and edit the data at any point.
The true power of wpDataTables lies in the combination of basic and advanced features it offers, and how easy it is to take advantage of both. You can create charts using Creation Wizard and also group similar rows.
With an impressive number of add-ons and a fantastic feature-to-cost ratio, it’s no wonder that wpDataTables is one of the favorite Google Sheets Integration WordPress plugins.
Key Features:
- Conditional formatting
- Customizable tables
- Advanced filtering
- Making dynamic SQL Queries with placeholders
- Row Grouping
- Pre-filtering tables through URL
- Calculating totals for columns
- Scrollable
- Editor input types
- Allowing users to see and edit only their own data
Price:
Annual subscription: Starting from $55 for one domain.
Lifetime: Starting from $210 for one domain.
2. Google Charts
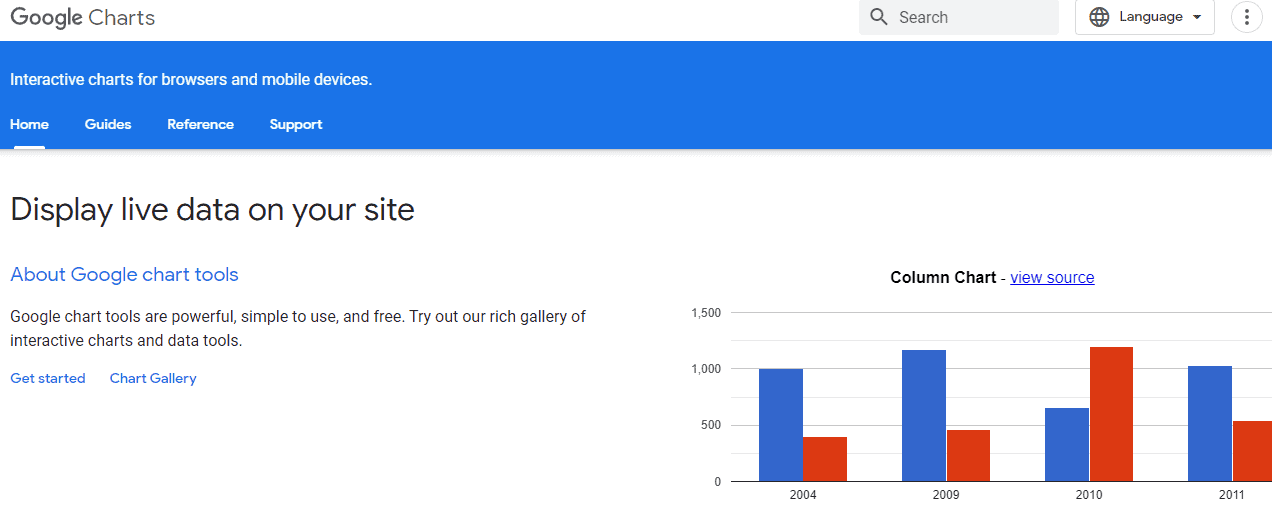
First of all, Google Charts is a free online tool. It offers a wide range of options. You can create charts, a map, or even a timeline. Also, you can see a database of ready-made templates that you can use.
It is very flexible and easy to use. If you do not like the template, you can create your unique chart. You can choose depending on your data and what you think you need.
3. LiveGap
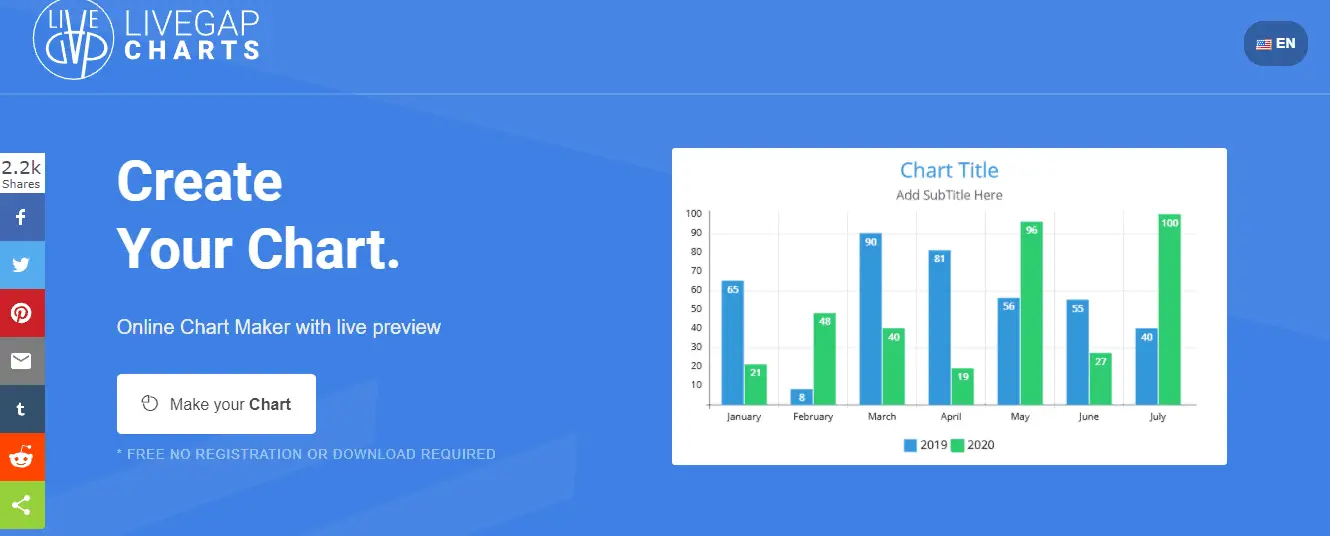
Another free online tool is LiveGap. You can easily create different charts, but it offers exciting options. You can also find templates, but you can create your chart. Do you still think the charts are boring?
Well, let’s change that, too. LiveGap has one fascinating option. You can animate the chart. You can set the effect and enter the number of steps to customize the animated effect. Interesting, is not it? It is not hard to use, and you can store charts.
4. Infogram
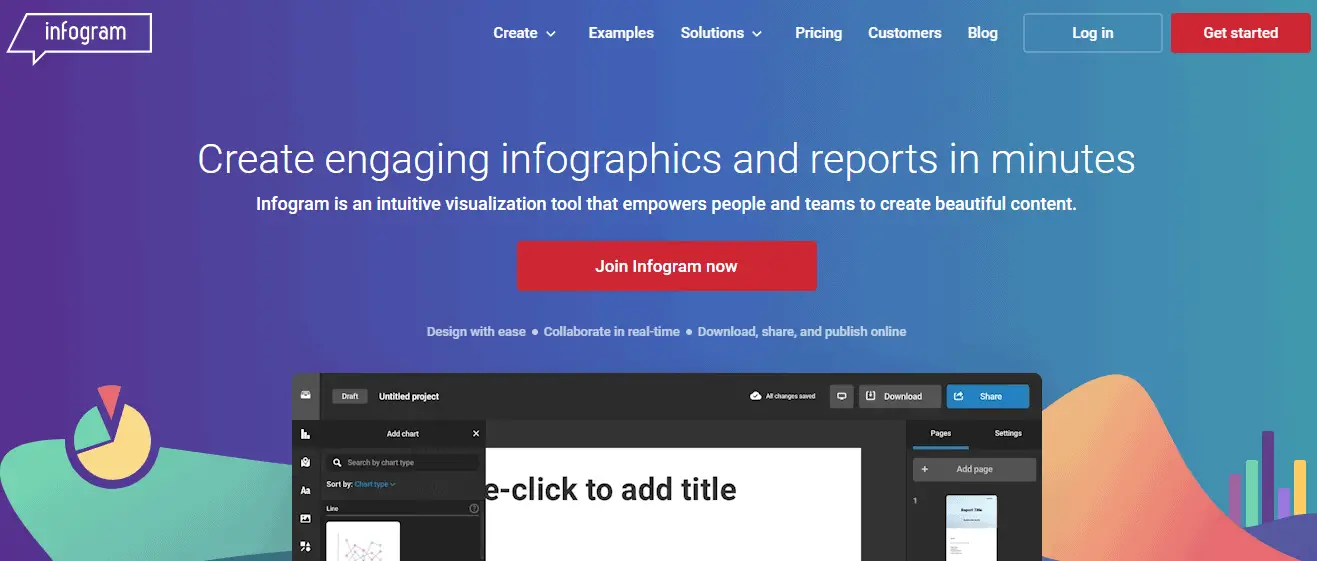
Infogram is a tool you will have to pay for. Infogram offers many different options that we do not know where to start. Graphing, animation, interaction, ease of use, etc. It is certain that if you pay for this tool, its options will not allow you ever to regret anything you have invested.
5. RAWGraphs
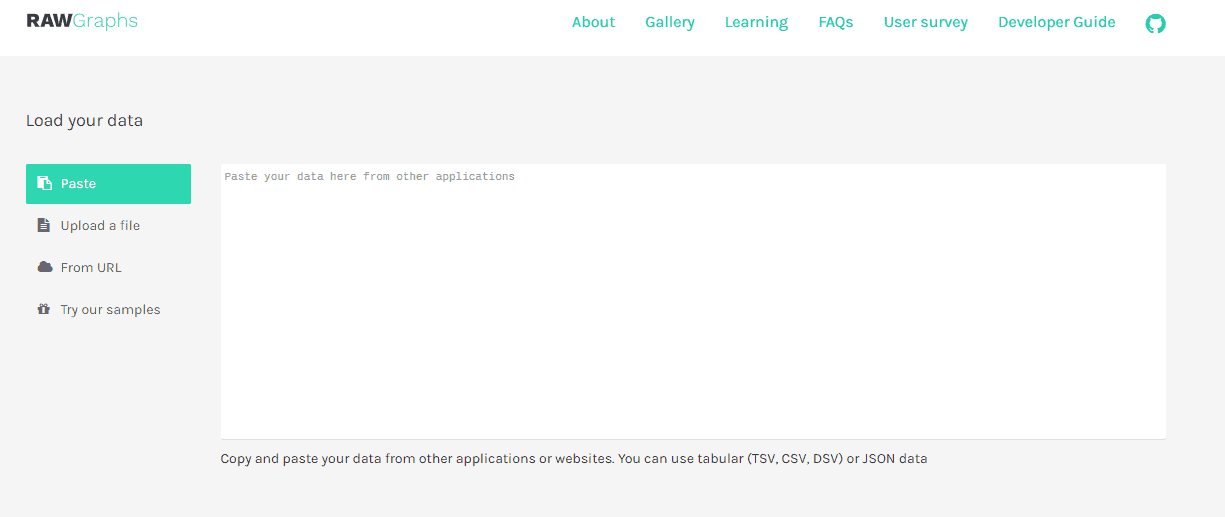
Free online tool. In RAWGraphs, you can create a chart, but you have many data visualization options. You can import / export data. You can enter data manually. Whatever you want. You can choose a chart. Standard or advanced? It’s up to you.
6. OnlineChartTool
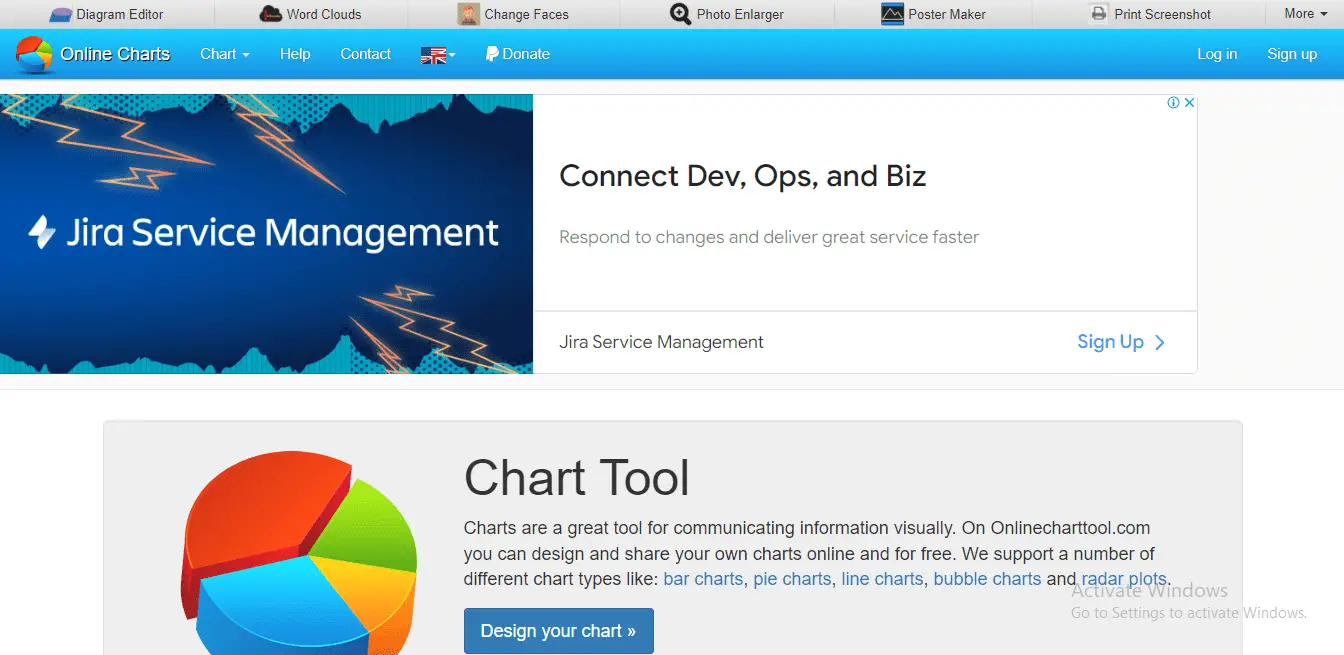
Lastly, another free online tool. We do not diminish the importance of paid online tools, although it is no secret that we all prefer them to be free. OnlineChartTool contains 12 different chart types. Also, you can find a simplified interface that makes it easy to edit style, format, and data.
Conclusion
Creating charts online is not a hard job. Especially if you use these above, add as much creativity as possible when creating. This will keep your attention, and the target audience will remember more data. Let’s not lie, you will remember more as well.