

Unless you are a mathematician, there’s a big chance you don’t like looking at numbers. To a regular person, numbers don’t communicate much, and too many of them at once can even be quite an eyesore. Unfortunately, numbers are essential for representing data in every field, data that is extremely valuable for creating marketing campaigns, making business decisions, educating, and many other things as well.
While doing these or any other tasks where there’s a need to present a large amount of data, it’s best you avoid giving yourself or anyone else looking at the data that eyesore we mentioned a few sentences ago. Now how exactly can you do that? With graphs, of course.
Contrary to the belief some people have, creating graphs is extremely simple and, with the help of tools readily available to us, can be done on just a few steps. What those steps are and which tools you should be using for your graph creating efforts is exactly what we’ll be discussing in this article. So if you are interested, keep on reading.
Step 1: Have your data prepared
Like we said earlier, graphs are visual representations of data, which means in order to create a graph, you will first need some data that you want to represent visually. To make sure your graph will be an accurate one, the data you feed into a graph creating tool has to come from a reliable source and also be free of any errors which is easily achievable if scrapped with a tool like ScraperBox. Depending on the tool you are using, you will be able to import the data in a number of formats and methods such as Excel files, CSV files, Google sheets, and of course, manually.

Step 2: Pick a graph-creating tool
Without this step, or more specifically without a chart creating tool, this whole process wouldn’t be possible. While most of us do have Excel on our PCs and could use that to create graphs, in all honesty, Excel is not really a popular option or one that is very rich with customization features. For this reason, most people will opt for using online tools instead, and so should you. To make the decision-making process easier for you, we will now do a quick rundown of some of the best online tools for creating graphs. We’re sure that at least one of the options we will present you with, will pique your interest. Check out Creative Fabrica to obtain incredible infographic templates!
Infogram
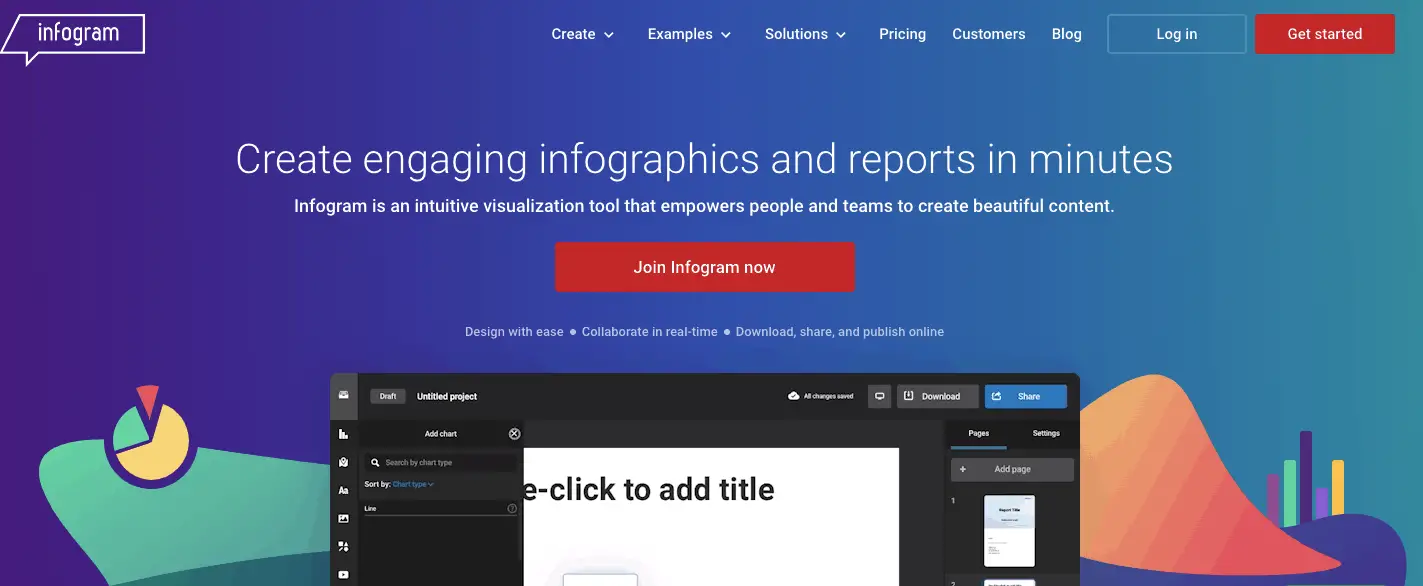
Infogram is an online tool for creating not only classic and interactive graphs but also infographics, dashboards, reports, maps, and social media graphics. Known for its intuitive interface and ease of use, Infogram is one of the most popular graph-creating tools on the market and was used to create more than 800.000 graphs thus far. Infogram enables you to input your data in multiple ways, which include Google sheets and JSON files. You can get Infogram in 3 different versions, the free version, or one of the two paid-for ones. The free version comes with 30 graph types but is a bit restricted, while the paid-for ones come with an icon library, over 200 maps, a private sharing feature, the possibility to download your work in a number of different formats, and so much more.
Online Chart Tool
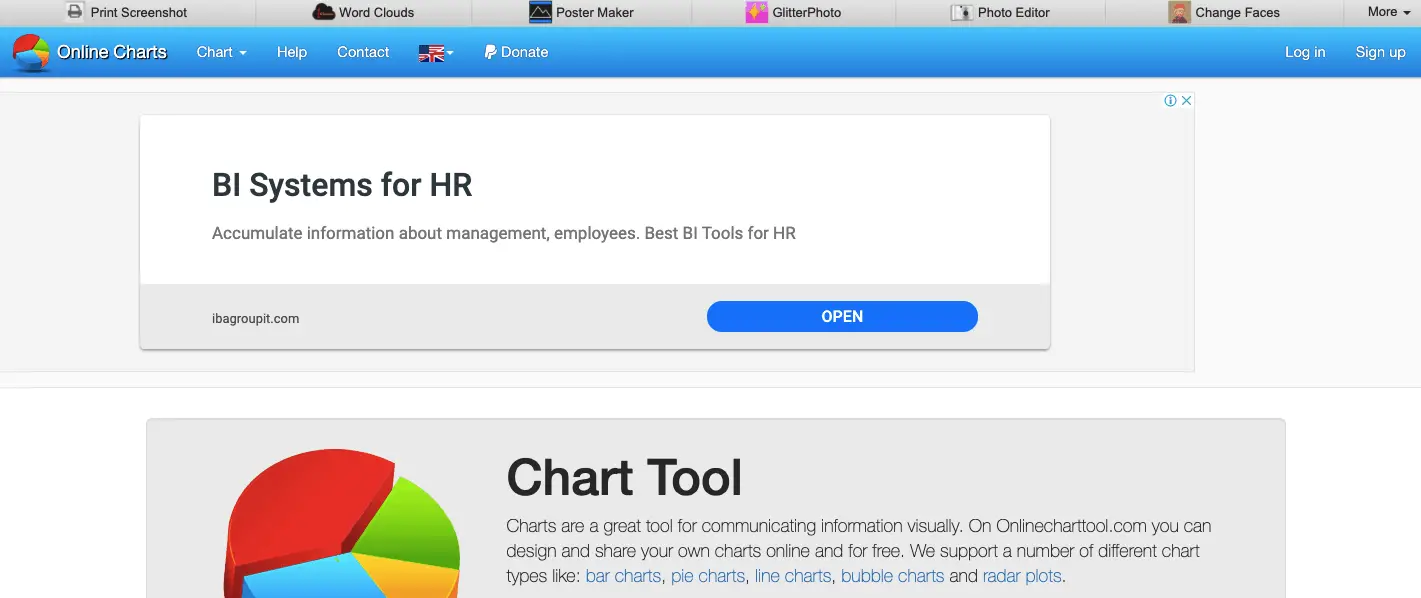
A completely free graph-creating tool that will provide you with all the essential features you might need. Using the Online Chart Tool, you can create different types of graphs such as line charts, bubble charts, pie charts, radar plots, and a few other types as well. Each graph type has its own unique look but also its specific set of variables and options. You can input data into the Online Chart Tool manually or using a CSV file. Regarding customization options, this tool will allow you to choose a chart style and a font and label type as well. Online Chart Tool, despite being free, won’t stop you from sharing or downloading your graphs, you will be able to do that in 4 different formats. The tool is available in 6 different languages and requires no registration unless you choose to do so.
ChartGo
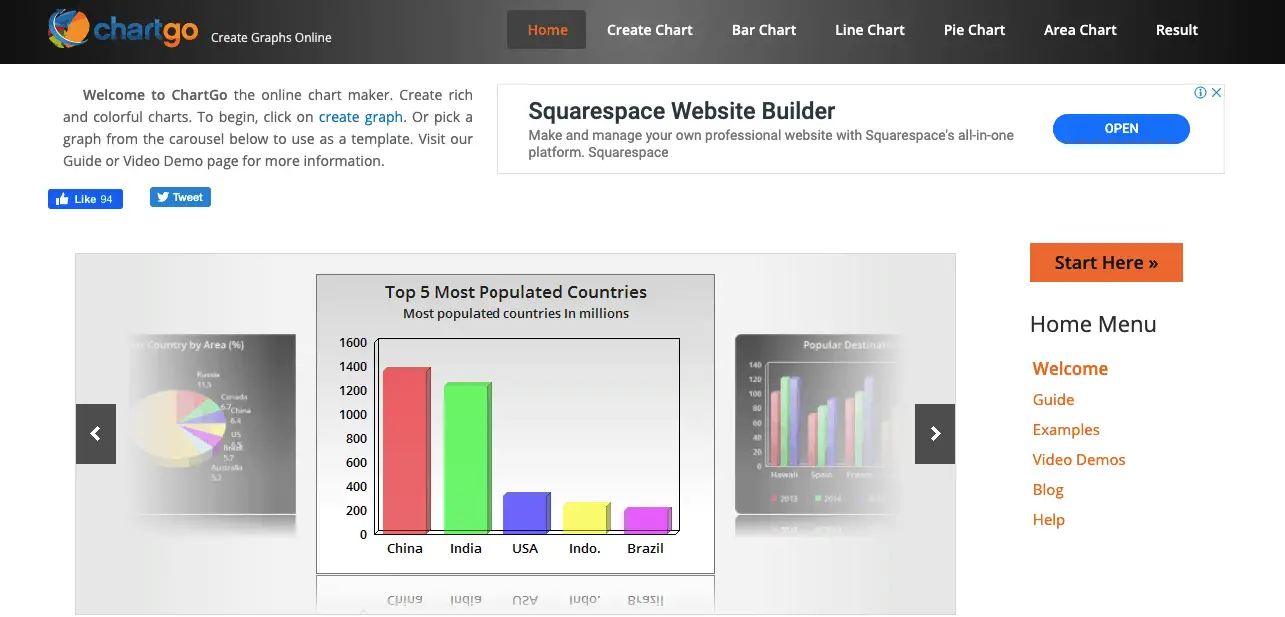
If you are looking to create graphs quickly without much hassle, then ChartGo is the tool for you. Everything with ChartGo is done in 3 simple steps which are: picking the settings, inserting the data, and clicking create. But of course, there is also the possibility to make adjustments to any of the graph types. ChartGo will even come with premade examples that you can use as templates if you are really in a hurry. Available graph types range from pie charts and stack charts to Excel and CSV charts, plus a few other ones as well. All-in-all, it’s safe to say that ChartGo is a very practical and straight-to-the-point tool.
Plotly

Plotly is definitely a more advanced graph creating tool than the other ones we mentioned thus far, largely thanks to its huge library, documentation, and tutorials available for every graph type. Using Plotly you can create 20 different graph types, which include 3D graphs, statistical graphs, and SVG maps. Each graph type is extremely customizable, with a ton of options you are free to tweak. Although Plotly gives you a lot of flexibility, in turn, it requires overcoming quite a learning curve. One special thing about Plotly is its ability to generate your graph in different languages such as Python, node.js, JSON, and a few other languages developers might find useful. Believe it or not, Plotly is open-source and completely free to use except if you want to use the enterprise version, which does come with a fee.
Visme
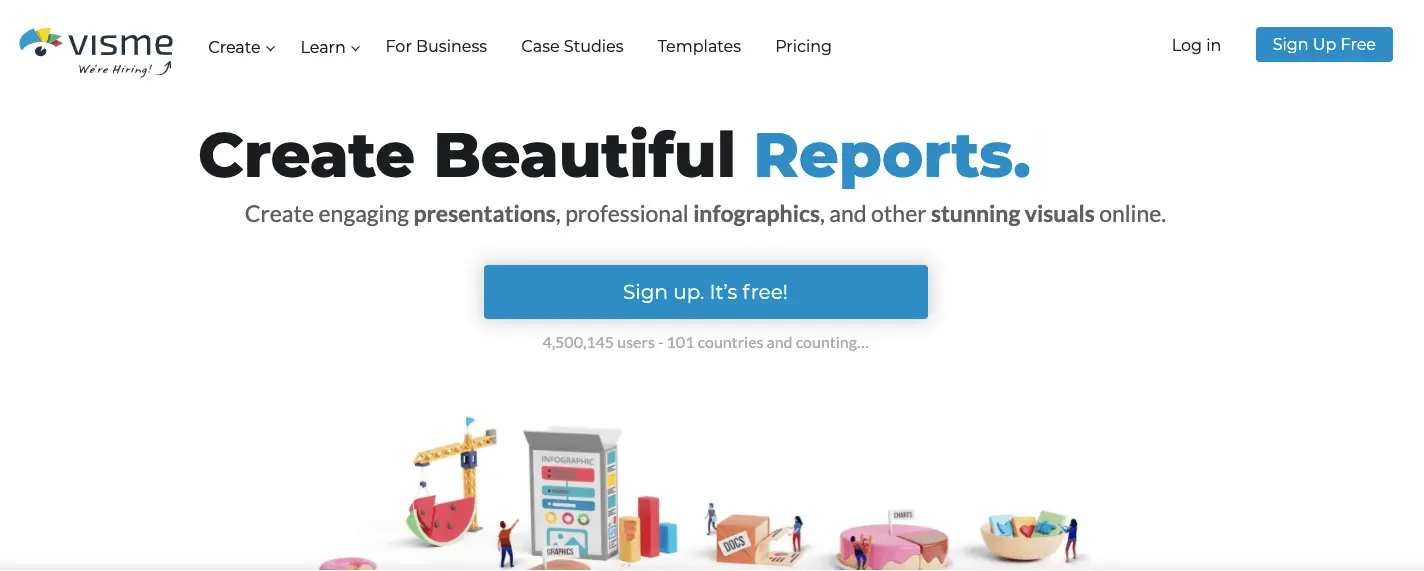
Visme is a feature-packed online tool you can use to present your data professionally through graphs, infographics, or presentations. Visme comes with hundreds of templates and formats you can use to create your project and is also super-fast in processing the data you feed into it. It will even allow you to incorporate animations in your graphs and to work on a graph collaboratively with other people. Using Visme, you can convert reports into infographics and choose to either download your graphs or share them online. Although Visme’s free version is more than decent, the paid one will give you more of everything (features, options, templates, data inputs, download formats, etc.). Taking all its features into consideration and the fact that the price of its paid version is one of the lowest on the market, it is clear why Visme is one of the most popular graph-creating tools.
Step 3: Choose a graph type
After you insert your data into your tool of choice, it’s time to pick a graph type. Depending on the tool you are using you will have different graph types to choose from, but all tools will surely come with the most commonly used ones like pie charts, bar graphs, line graphs, scatter plot, histogram, etc.. Which type will be the best one for you? Well, you’ll have to make that decision on your own. The best way to determine that will be to see how your data looks when presented in different graph types. With most tools, if not all of them, switching between graph types is extremely easy and fast and will take only a click of a button.
Step 4: Make some final adjustments
Once you decide on a specific graph type, the graph creating process is basically over, the only thing left to do is to make some minor adjustments to the graph’s visual aspects. For example, some of those adjustments could be color coding the data, applying the necessary labels and legends, adjusting the graph size and axis measurements, basically making any tweak you think will make the graph look better to your audience.

Also, one small but very important thing you have to do is to give your graph a title, so there is no confusion about what that specific graph is representing.
Step 5: Export your graph
The last and final step of the process is to export your graph. You can save it to your computer or cloud storage, share it with others, print it, use it in a document/presentation/app/website, essentially do with it whatever led you to create the graph in the first place.
Conclusion
And there you have it, a simple and easy 5-step process for creating a graph online. We hope you enjoyed reading this article and that we made every step as clear as possible. We wish you the best of luck and a lot of fun in your graph, creating adventures!